


Hurricane Dorian was an extremely devastating and deadly storm that eventually became the most intense tropical cyclone to ever strike the Bahamas.
It was a category 5 Atlantic storm with wind speeds peaking 295km/hr.
Top 3 Apt Hurricane Dorian Models
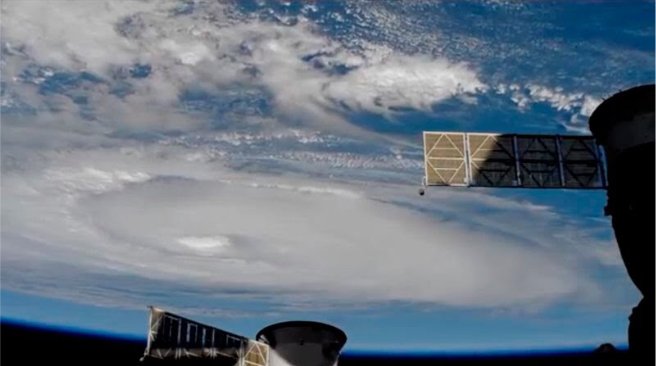
Satellite Images of Hurricane Dorain by NASA.
Developed from a tropical wave on August 24th, it moved and underwent rapid intensification to finally make its first landfall at the Bahamas on the historically cursed Labor Day, but who knew it had more in it to shatter the eastern coast?
Yes, you read right, no wonder why it was so hazardous.
“The longer range forecasts had the storm moving across the Bahamas at a steadier pace, and then, even as the forecast shifted, the full degree of the slowdown wasn’t anticipated,” said Michael Brennan, the National Hurricane Center’s hurricane specialist branch chief.
“A lot of it was the evolution of the steering flow.” There were several discrepancies and short fallings by the models used to effectively speculate the path, most of them figured it would eventually fall out of speed after making landfall at the Bahamas.
Yet, one could wonder, how do these hurricane models work, what are the major ones? Let’s talk about a few Hurricane Dorian models used-
Spaghetti Models
As the name suggests, when individual computer forecasting tracks of the hurricane are put together, they look like different strands of a spaghetti, and hence the name. It’s also called Spaghetti Plots.
The National Hurricane Centre of the United States sends out Hurricane Hunters, uses weather analysis, satellite imagery and many other forecast models to determine where the tropical storms and cyclones are headed.
As discussed earlier, the models are computer generated and come from a variety of places like the National Weather Service of the US, Canada’s Deterministic Prediction System, and even the UK Met. Office. These are primarily based on climatology, thermodynamics,
statistics, and atmospheric dynamics. What the spaghetti model does is simply combine the predictions from the various other models that we will talk about. That is why it is assumed to be one of the most accurate and apt ones, but this didn’t really become the case during the Hurricane Dorian.
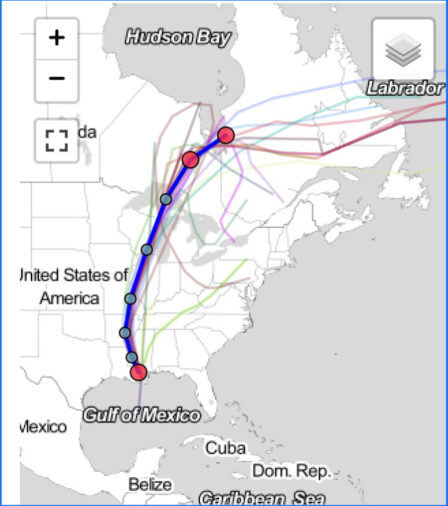
Interactive Spaghetti Model for the Hurricane Dorain.
What makes the spaghetti model so distinctive?
Yes, if you’re wondering that, you’re fairly on the right part. The best feature of the Spaghetti model is its ability to compare between numerous other models used and how they are different in their approach, how other factors might be influential in their forecast etc.
All in all, it gives you a better picture by comparing every other model and taking out the average path which is in compliance with all other models.
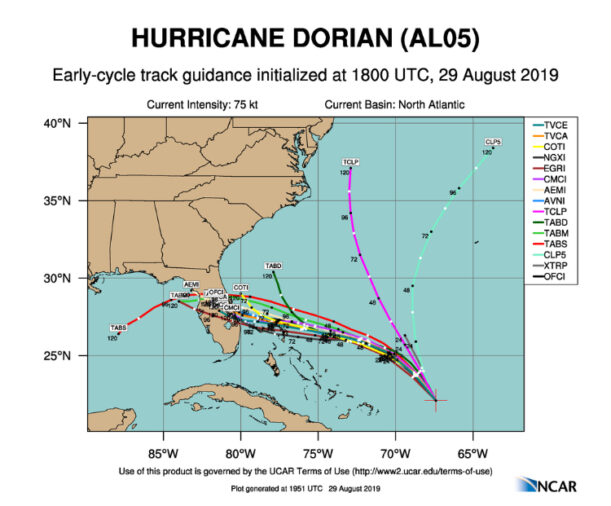
For example, if you look at the above picture of the Hurricane Dorian models, you can see how different models are different in their approach to speculate the Hurricane’s path.
So it allows you to effectively consider all the possible scenarios of potential pathways, including the worst case and the best case scenarios so you can see an entire picture of potential outcomes and relief measures can be then taken place accordingly.
Interesting right? Well, adding to it, they also are useful in the case of a developing storm system that officially has not become a tropical depression or tropical storm yet. This means that no official agency has released its official paths yet.
Imagine getting an early heads up as to where a tropical storm or hurricane may head! Once a tropical disturbance has already become a cyclone, there are various official paths released by models which we will see later. Again here, Spaghetti models will enable us to see how confident these paths are, just like in the case of Hurricane Dorian Models.
Global Forecast System
The Global Forecast System ( GFS)is a global weather speculation system based on statistics from the National Weather Service of the United States. It is based on global computer models and variational analysis. The operation for every day includes a mathematical model run 4 times which produces a forecast for 16 days in advance.
The forecast skill generally minimizes with time and as a result, for longer-term forecasts, it is no more of use. It is most accurate for medium-term forecasts. Since it is mostly relevant for medium-term forecasts, for the first 10 days it can go up to 13 kilometers of horizontal resolutions and then 27 kilometers from the next 6 days (that is 166 days.)
But is it even accurate?
Good question. Well, for starters, it was allegedly the most accurate Hurricane Dorian model. But, everyone has a growth/progress journey behind them and so did this model! As of 2015, it was far behind the other models, it even made the news for wrongly predicting the landfall time frame of Hurricane Sandy.
The blame game started and it blamed the National Weather Services for their lack of technological and computational resources. Ouch, well that must have hurt! In response, the National Weather Service purchased new supercomputers, increasing processing power from 776 teraflops to 5.78 petaflops.
In 2018, the processing power was increased again to 8.4 petaflops. There has been no looking back since then! In 2019, as a result of ten fold increase in supercomputer powers, it decreased the horizontal resolution to only 9 kilometers for 10 days! Quite a journey, huh?
The GFS model was propounded to be one of the most accurate models out of all Hurricane Dorian Models.
European Centre for Medium-Range Weather Forecasts
It is an intergovernmental organization of 22 European countries located at Shenfield Park, Reading, United Kingdom. It has one of the world’s largest supercomputer complexes and archives of numerical weather prediction data.
It was formed in 1975 preceded by the constant urge to pool all of Europe’s scientific and technological resources along with Europe’s meteorological services and institutions for the production of weather forecasts and speculations, particularly those belonging to the medium-range time frame.
Their core objectives include providing apt medium-range global weather forecasts 15 days in advance, monthly forecasts, and seasonal forecasts up to 12 months.
Why is ECMWF so apt?
Well, the obvious reasons include its ability to pool resources and data statistics from 22 countries National Weather Services . As a result, it becomes more powerful with the help of a handful of data statistics, technology and supercomputers! Besides, it works hard on a day to day basis. It’s daily tasks include
- Air quality analysis
- Atmospheric composition monitoring
- Climate monitoring
- Ocean circulation analysis
- Hydrological prediction
The Centre operates and develops global atmospheric models and data assimilation systems for the thermodynamics, dynamics and composition of the Earth’s atmosphere and for interacting parts of the Earth system.
It uses numerical weather prediction methods to prepare forecasts and their initial conditions, and it contributes to monitoring the relevant parts of the Earth system.
ECMWF’s operational forecasts are obtained from its “Integrated Forecast System” which takes place every 12 hours for forecasts in advance of 12 days.
This includes a “deterministic forecast” mode and an ensemble. These are comparatively high in resolution as well as computational expense. All of this makes the ECMWF one of the most reliable sources in the world!
Which one is better? The American or the European one?
Questions like these are always asked by people worldwide, yet with different contexts. Yet, the passion to be better than each other takes these debates ahead and gives them a new spicy flavor.
But which one is actually better? Well, they are diverse programs which run on various supercomputers, the particular subtleties of which would make the greater part of our heads hurt, however, there are some essential contrasts.
“The Euro is run just two times per day since it takes additional processing power. The GFS is run four times each day. So we have it all the more regularly,” said Andy Johnson, previous WTVT-Ch. 13 on-air meteorologist and current confirmed meteorological advisor.
“In America, we have free access to all the information that the National Oceanic and Atmospheric Administration offers.
The European people group energizes to $250,000 on the off chance that you need all that they offer. So they have more cash to spend on innovative work.”
The distinction also has to do with “initialization,” Johnson said, which is figuring out the contemporary weather conditions used as a starting point to feed into the fashions. “You assume we know precisely what the weather is, however we genuinely don’t, because big quantities of the earth are covered by means of water.”
He further stated that they have to make assumptions no matter, the difference lies in making as close assumptions as possible. The same models are run time and again with different variables to account for errors. The outcome can be known as an ensemble.
An ensemble fabricated from various fashions’ ensembles can be used to smooth out the tough edges in a forecast.
All in all, the European model is statistically more better than the American one, but in reality there is not much of a difference, as it falters too.
It did falter with its Hurricane Dorian Model stating that it would go to Florida. So, only assumption based is generally risky and both models are their flaws and weaknesses. They should work with each other.
Why did the predictions go wrong?
You’re still probably wondering this, even though we have so many supercomputers and technological changes, why do we go wrong? Well, after all one can only trust the technology upto an extent.
Reliability on technology always exposes the other side of the coin, the risk in its failures. Hurricane forecasters said that the models they depended on failed because they did not acknowledge the strength, wind speed, intensity and storm surge of the deadliest storm to hit the Eastern coast of the USA.
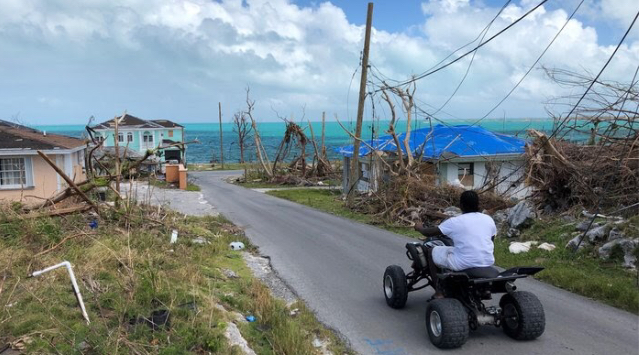
Photo from Oct. 2019 showcasing the havoc created
Post analysis of the storm was undertaken by the National Hurricane Center and a report was put forward by them to understand the short fallings by meteorologists.
As expected, the report said meteorologists did not do a formidable job and similar were the reports of Hurricane Dorian Models. Dorian began as a small disturbance in an area in the Caribbean with dry air, which tends to suppress hurricane formation. As things started heating up, they were unable to detect the storm’s eye.
The head of the National Hurricane Center, Ken Graham said, “Dorian’s forecast was extremely difficult because we were tracking three centers.” One early track for Dorian had it crossing over Hispaniola where high mountains were expected to tear the storm apart.
Another showed it heading toward Florida. The surprise came when, as Dorian formed, its track shifted to the right. Graham said, “That means less interaction with land, warm water (and) more time to get geared up and stronger and eventually reach Category 5 strength before reaching the northwestern Bahamas.”
The Trump Controversy
Here’s an excerpt of the most powerful president’s mishap that became the talking point all around the world. On Sept. 1, Trump tweeted that Dorain’s eye would make landfall in the state of Alabama.
Whereas, the National Hurricane Centre and all the other forecasts had predicted it to be further upcoast way north of Alabama.
Turns out, Trump was apparently using information which was 7 days old.
Twenty minutes later, the Birmingham, Alabama office of the NWS tweeted to contradict Trump, saying that Alabama “will NOT see any impacts from Dorian”.Over the following days Trump insisted repeatedly that he had been right about the hurricane threatening Alabama.
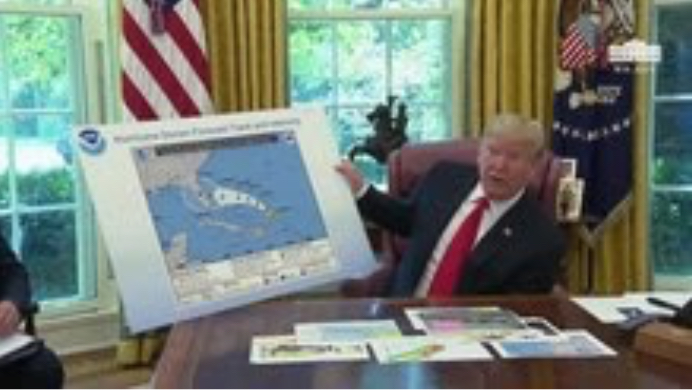
Trump displaying the altered modified version of the Hurricane.
On September 4, Trump tweeted a modified image given out by the National Hurricane Centre on August 29 by drawing a line with a black sharpie marker.
The incident resulted in the hashtag “Sharpiegate” trending on Twitter and Trump became a point of humor. What was next to follow, on 6th September, the NOAA issued a statement that its predictions fell in line with Trump’s predictions and it criticized its Birmingham Office for allegedly denying it.
This raised several eyebrows about the influence of politics in independent intelligence organizations like the NOAA and NWS.
Combining all these, it was quite honestly a weird time for National forecast agencies, the government of various places like Bahamas, Florida and even Alabama including their headmaster Mr. Trump. Hurricane Domain Models not only went wayward, they left everyone embarrassed.
Table of Contents

Add Comment